
Elite feature
Your map, holding your data.
Data Layers let you decide exactly what information every waypoint, route, and area on your map has to record — then style the map so you can read that data at a glance. Field-grade data collection, on the map you already trust offline.
Included with Elite. Works fully offline. Syncs across your devices and your team.

The problem
A pin and a note only gets you so far.
Every mapping app lets you drop a waypoint and type something in. That works until it doesn’t.
Come back from a season of fieldwork and you’ve got two hundred waypoints named things like “cam by the creek,” “stand — check this one,” and “Camp 3 (2).” Half have a note. A quarter have a photo. None of them are consistent, because nothing ever asked you to be consistent.
Now try to answer a simple question. Which sites haven’t been checked in three weeks? Which units are still open? Which of these need follow-up before the snow flies? You can’t — not without opening every single one and reading it.
The information was never the problem. The structure was.
What it is
Define it once. Collect it every time. See it on the map.
A Data Layer is a map layer where you set the rules up front. You decide what every point, line, and area in that layer has to record — a status, a species, a measurement, a photo, a yes or no. From then on, every time you mark something, the app asks you for exactly those things.
Then you tell the map how to draw it. Green for complete, red for needs work. Bigger icons for bigger numbers. A different symbol for every category. The map stops being a pile of pins and starts being a picture of the job.
It’s the difference between notes about your work and a record of it.
How it works
Three steps. About ten minutes.
No GIS training required.
Define what you need to record
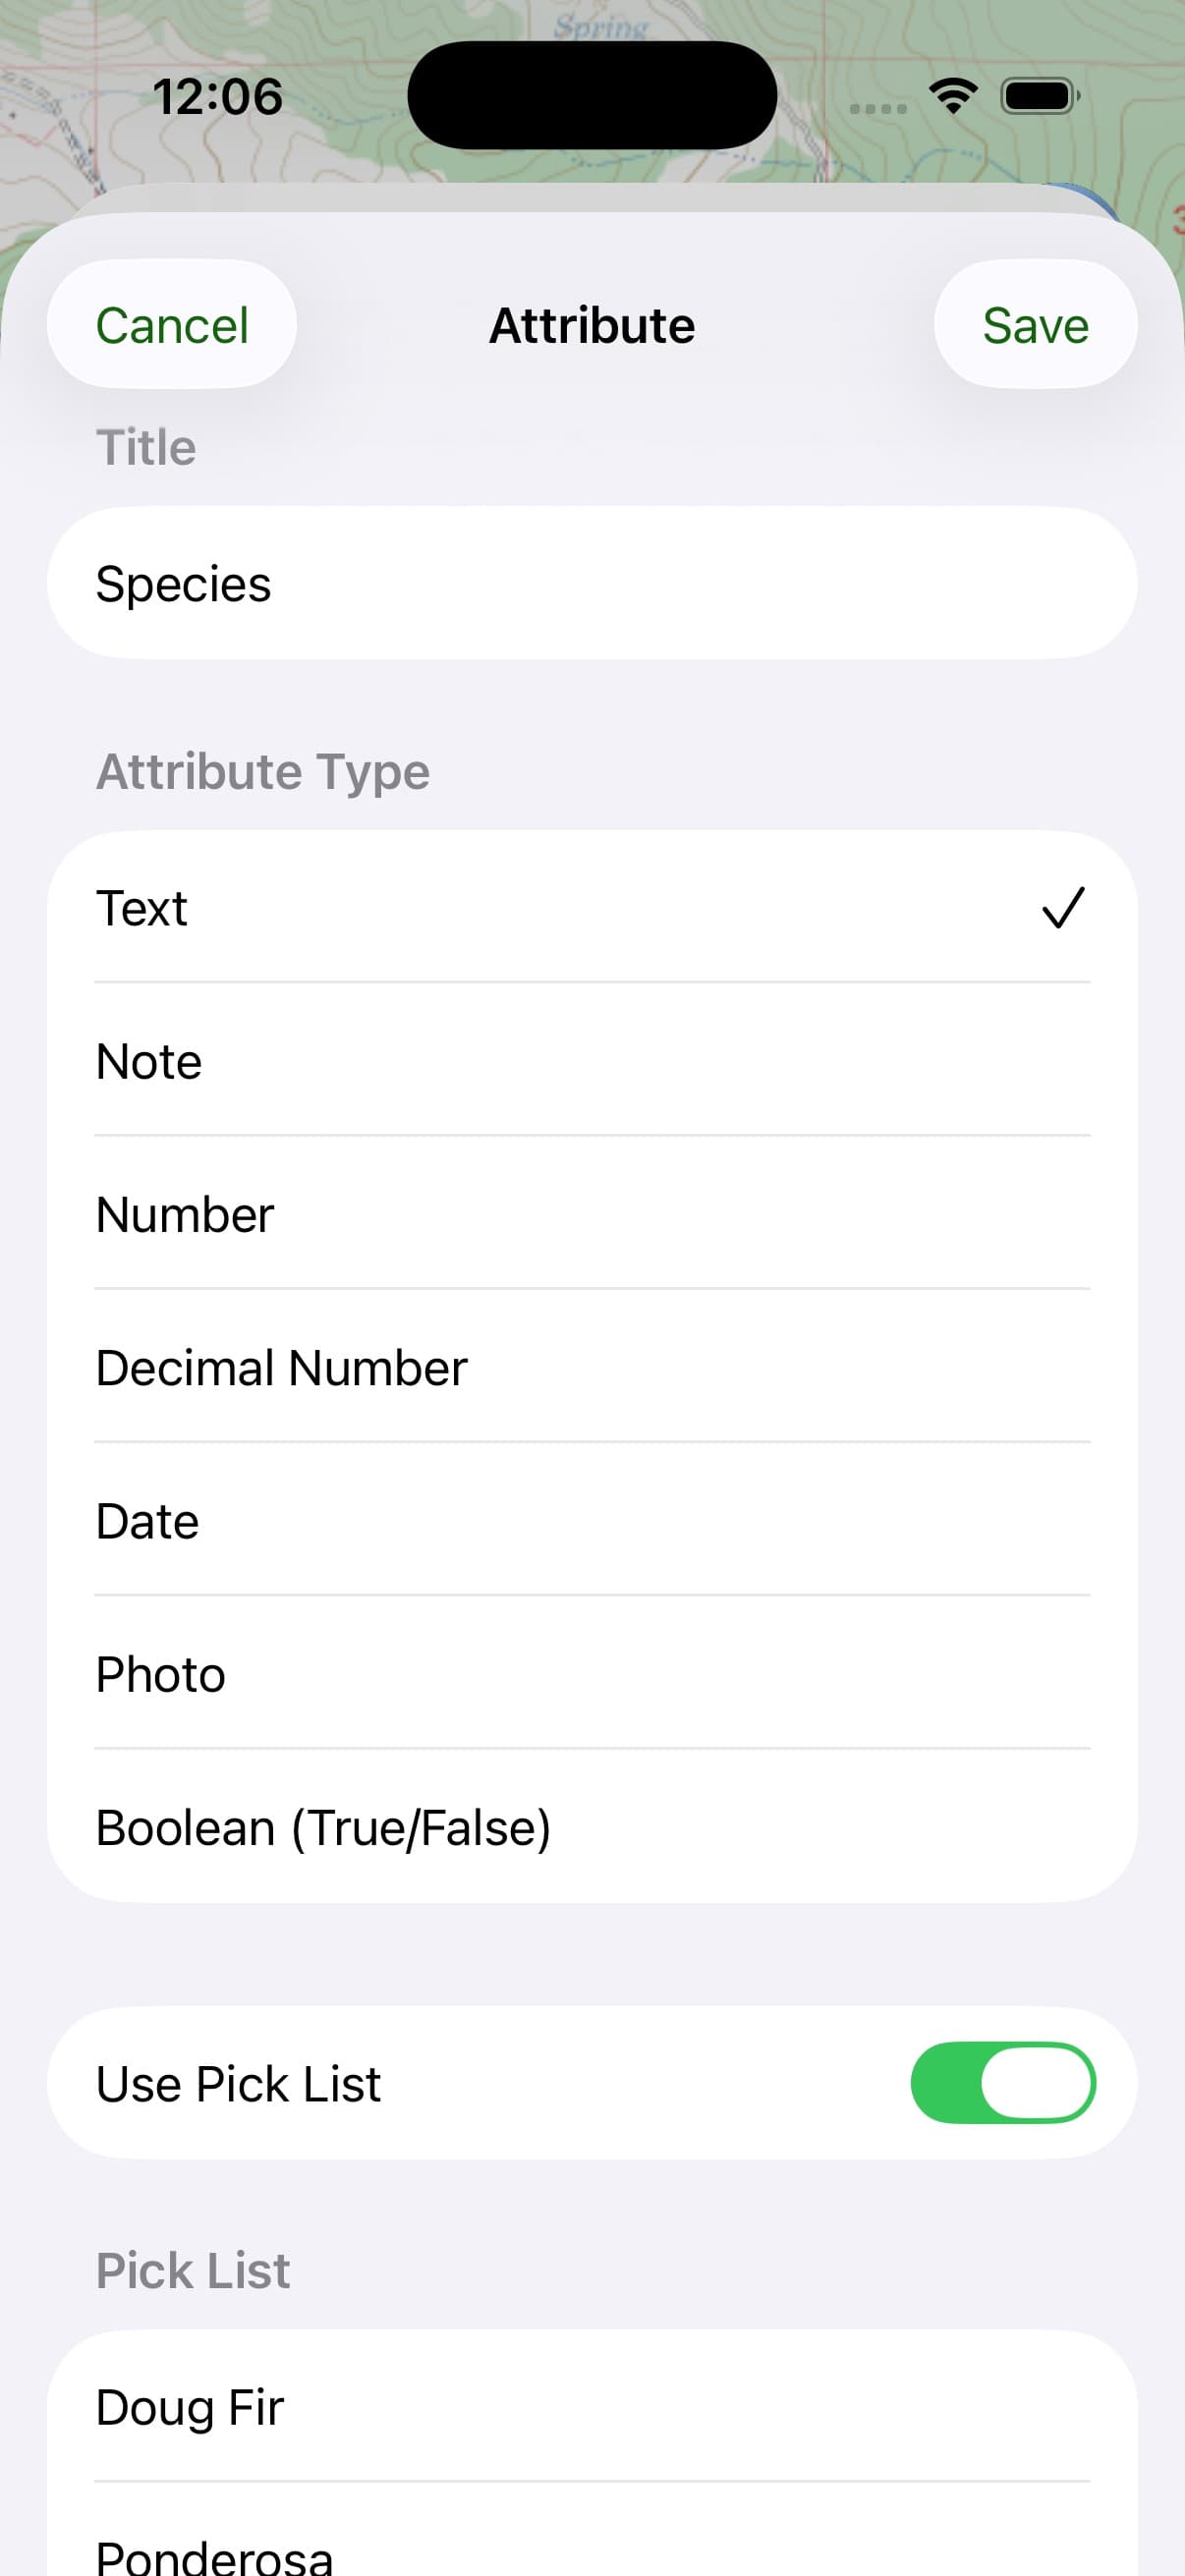
Build your attribute schema: the list of fields every object in the layer will carry. Text, notes, numbers, decimals, dates, photos, true/false. Text fields can use pick lists — a fixed set of choices like Easy / Medium / Hard or Open / In progress / Complete — so the data comes back clean instead of ten spellings of the same word. Number fields can auto-increment, so your plots, segments, and samples number themselves as you go.
This is the part that does all the work later. Five minutes of deciding what matters saves you a season of guessing.
Collect it in the field
Turn the layer on and it captures everything you mark. Drop a waypoint, trace a route, draw an area — the app prompts you for the attributes right there, while you’re standing in front of the thing you’re recording. Not back at the truck. Not that evening. Right then, when you actually know the answer.
Works completely offline, same as the rest of the app. No signal, no problem.
Let the map show you
Set style rules that read your attributes and draw the map accordingly — a different icon for each category, line weight and pattern driven by what a route is, a fixed color for a specific value, or a color ramp across a range of numbers so low and high read instantly.
Open the map and the answer is already there. You don’t query your data. You look at it.
Icon Style
A different symbol for each category of waypoint.
Line Style
Line weight and pattern driven by what a route is.
Color Style
A fixed color for a specific value.
Variable Color Style
A color ramp across a range of numbers, so low and high read instantly.
Define it. Collect it. See it. That’s the whole feature.
What you can record
Seven attribute types. That’s the whole vocabulary.
Text
Names, IDs, short labels. Turn on a pick list and it becomes a fixed set of choices instead of open typing, so the data comes back clean.
Note
The longer free-form field, for when a sentence is the right answer.
Number
Counts, years, ratings, heights. Set it to auto-increment and it numbers itself: plot 1, plot 2, plot 3, without you thinking about it.
Decimal Number
Measurements that need precision. Diameters, depths, acreage, pH.
Date
A real date field, so last inspected and treated on sort and compare properly instead of living in a text box.
Photo
Attached to the record, not lost in your camera roll.
Boolean
The true/false questions. Gate locked? Hazard present? Signed off?
Set one attribute as the object’s title and it shows up right on the map — so a waypoint reads “Stand 4 — Needs repair” instead of “Waypoint 37.”
Pick lists mean the data comes back clean. Auto-increment means you stop naming things.
In the field
What people actually build.
Eight real setups. Steal any of them.
Forestry & land management
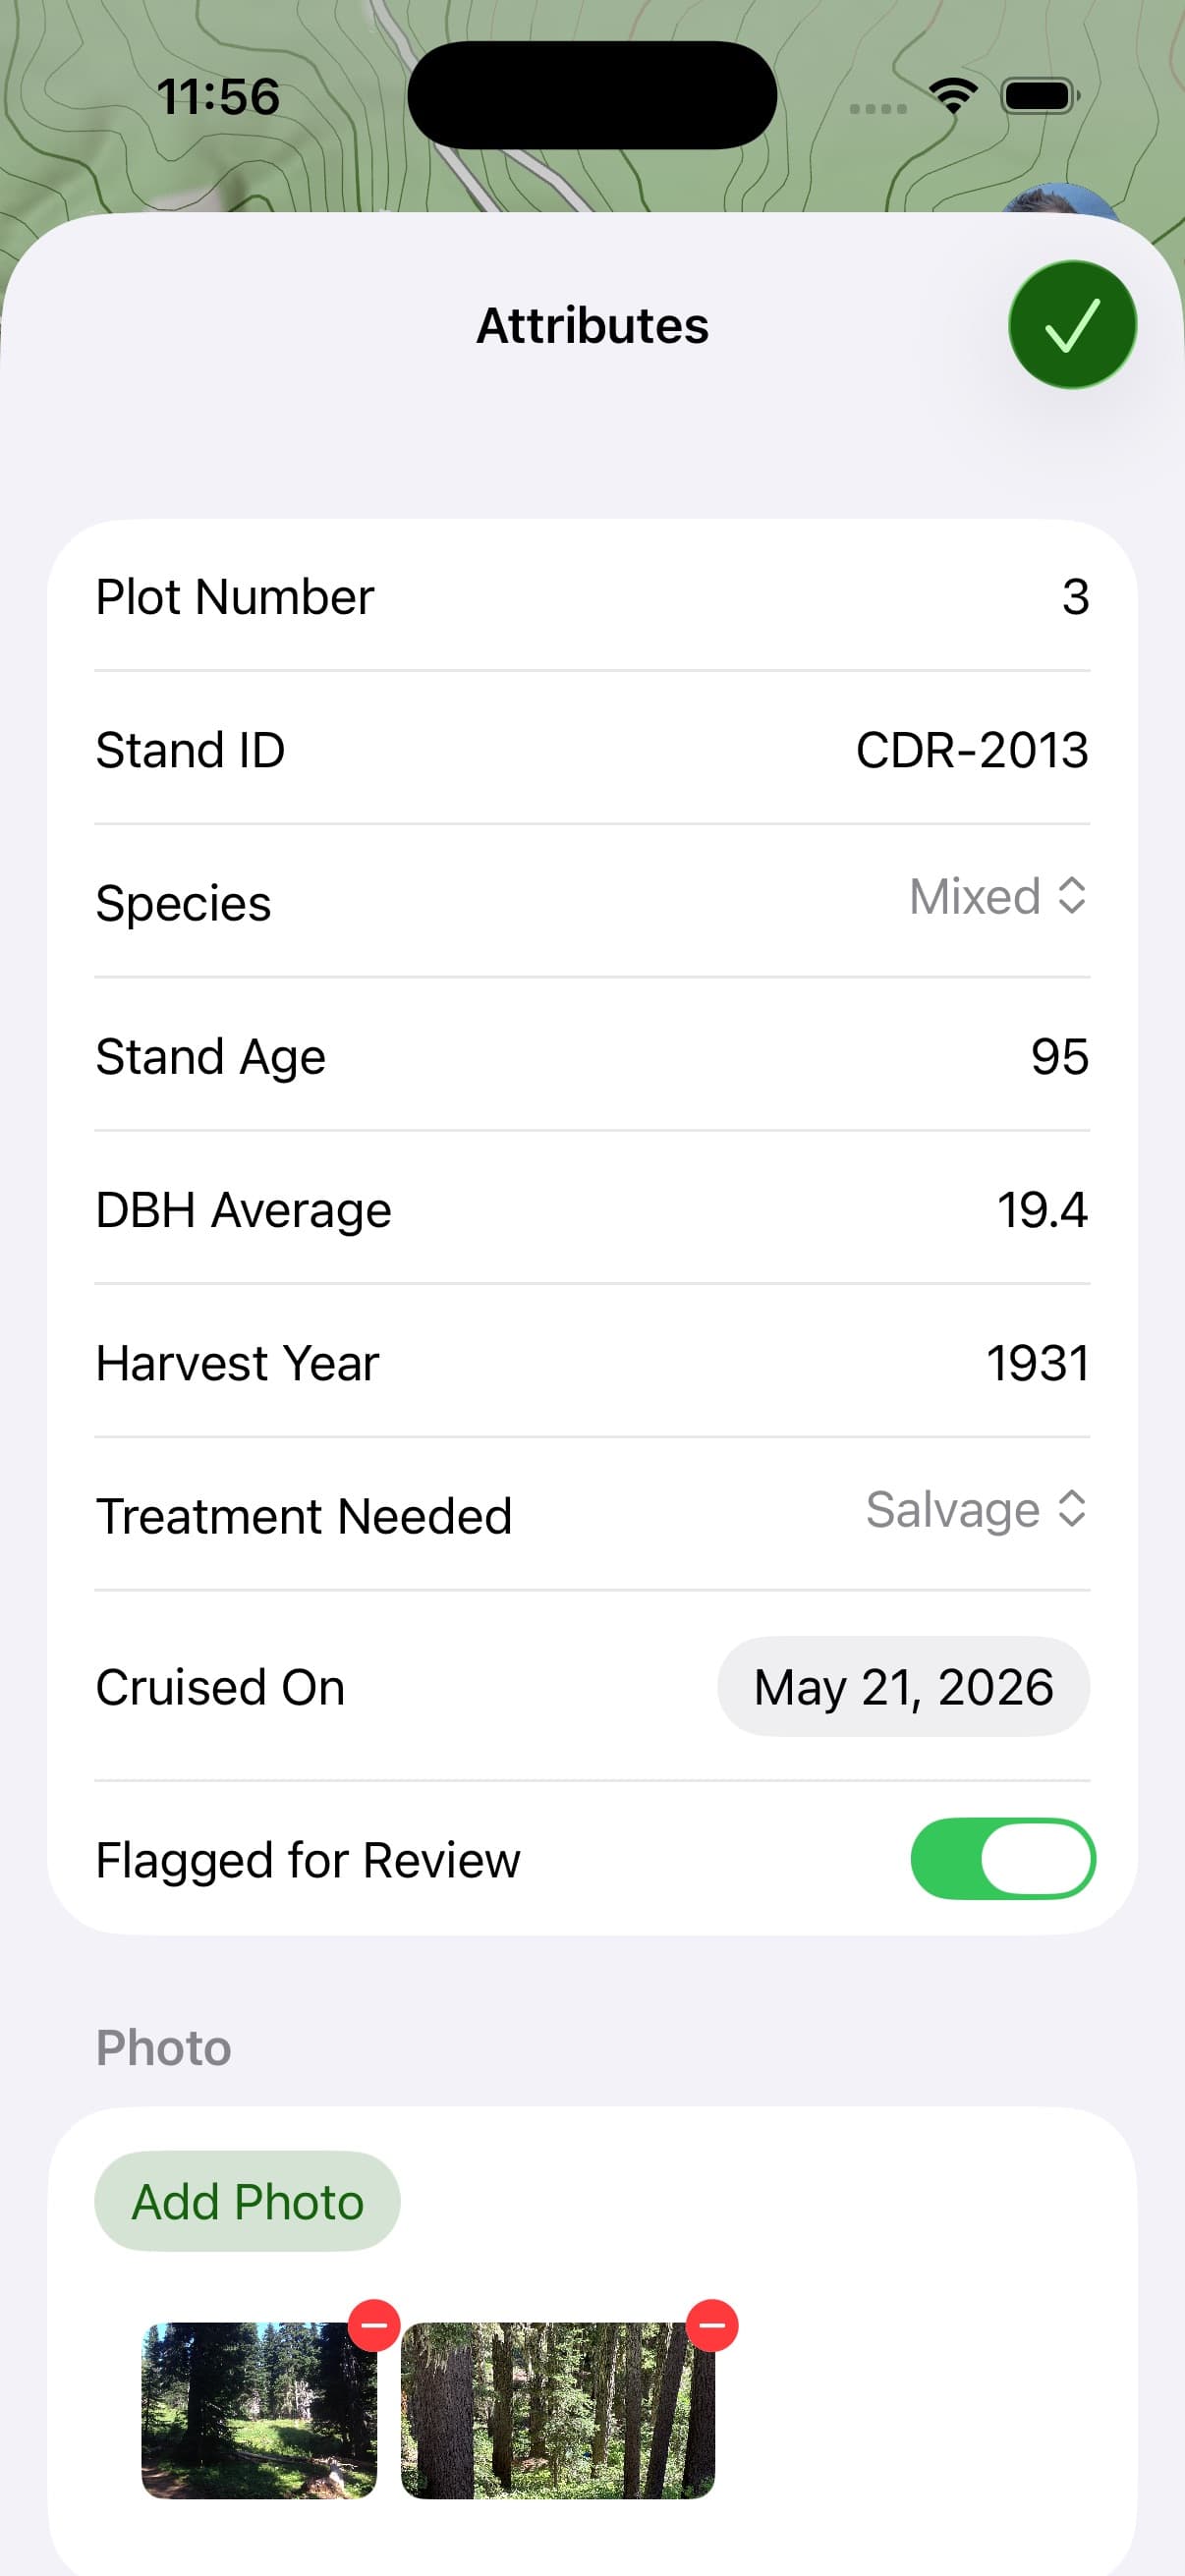
Timber stand inventory
You’re cruising a property and every stand needs the same information recorded the same way, or the report at the end doesn’t hold together.
Attributes
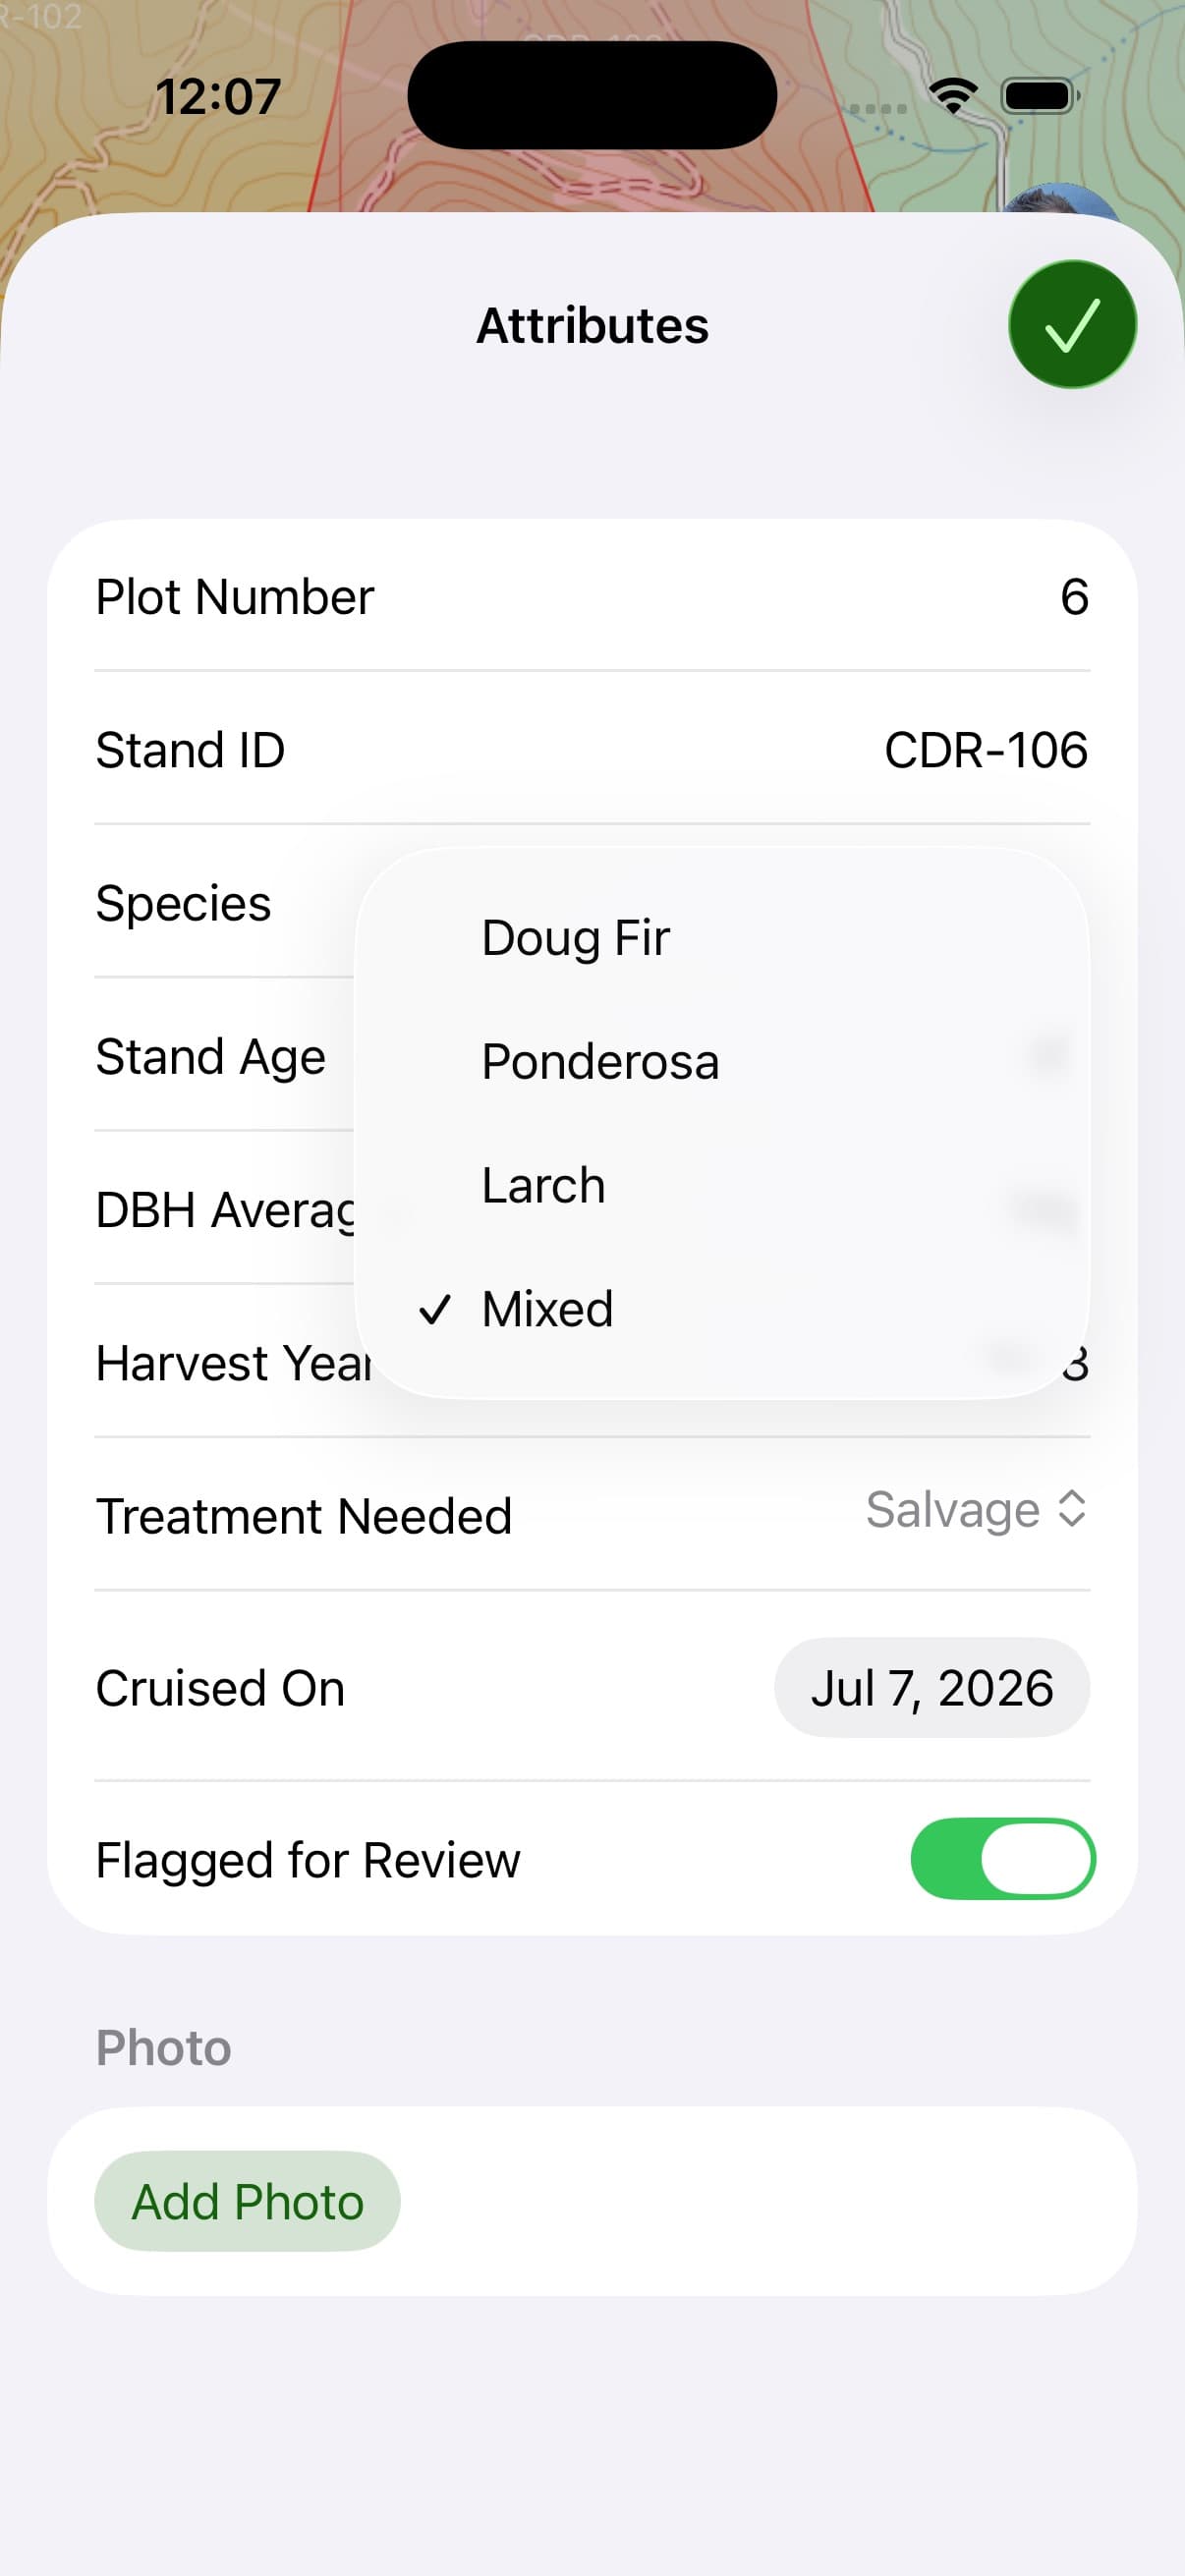
- Plot number (number, auto-increment)
- Stand ID (text)
- Species (pick list: Doug fir / Ponderosa / Larch / Mixed)
- Stand age (number)
- DBH average (decimal)
- Harvest year (number)
- Treatment needed (pick list: None / Thin / Salvage / Replant)
- Cruised on (date)
- Photo
- Flagged for review (boolean)
Style rule
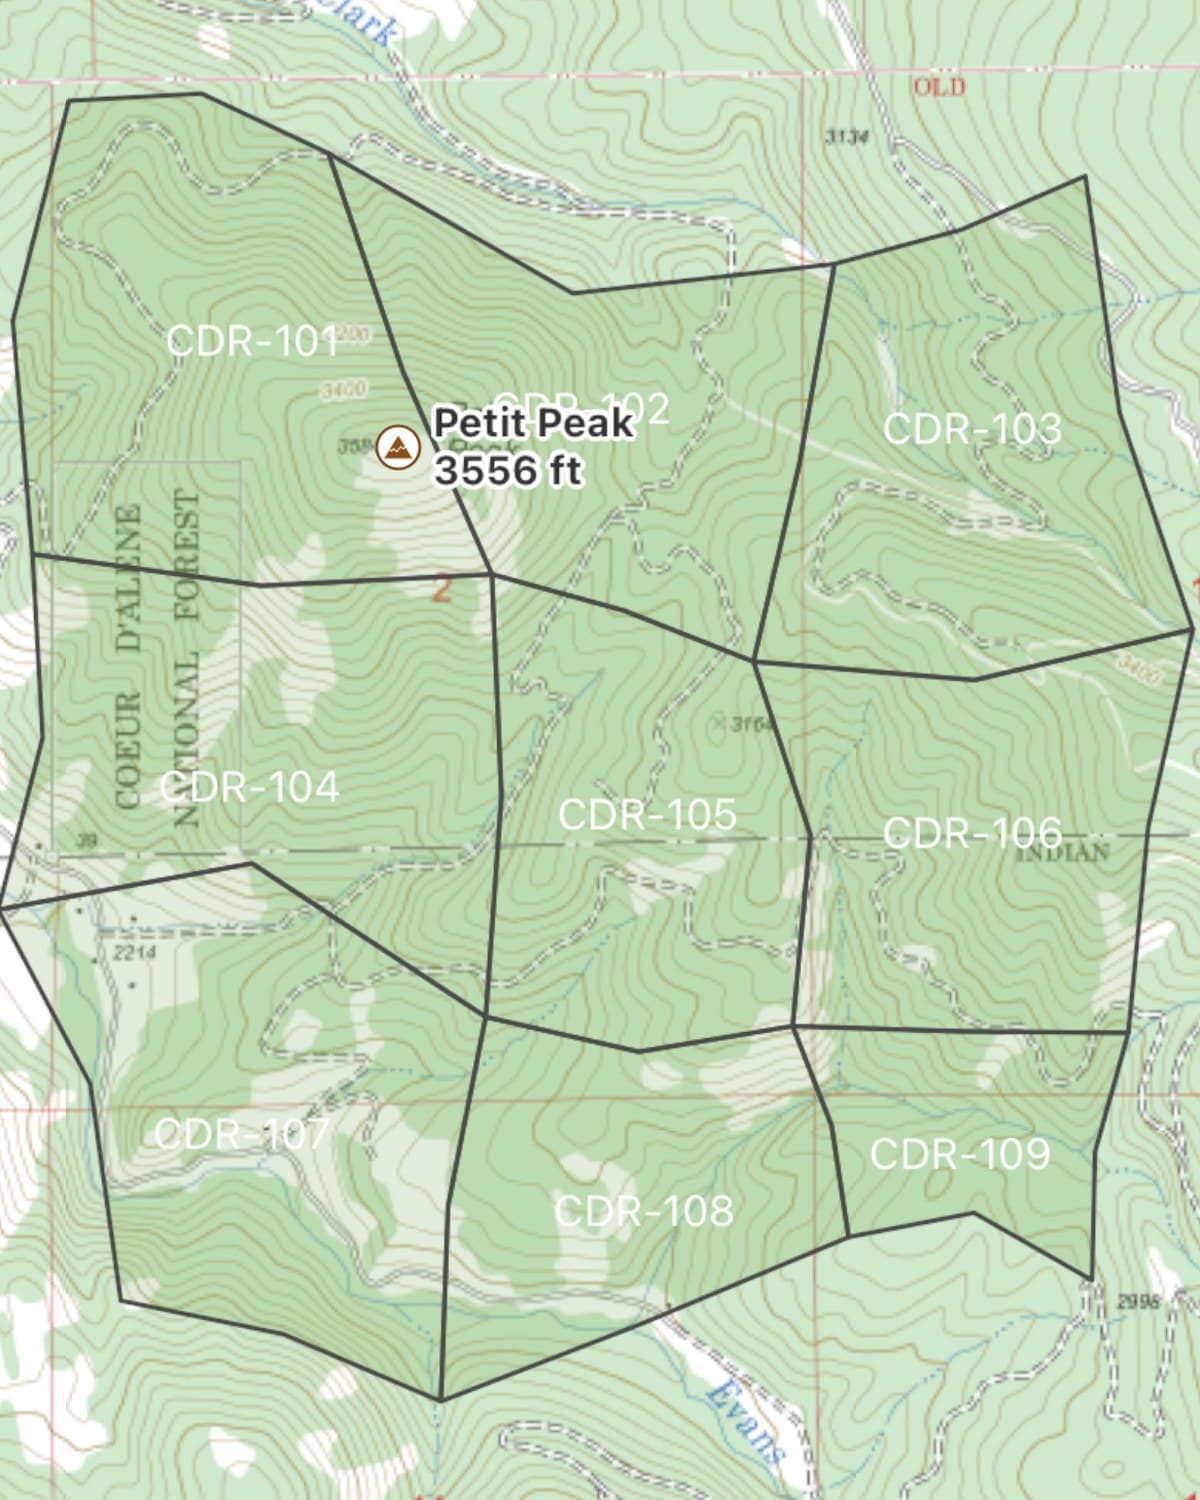
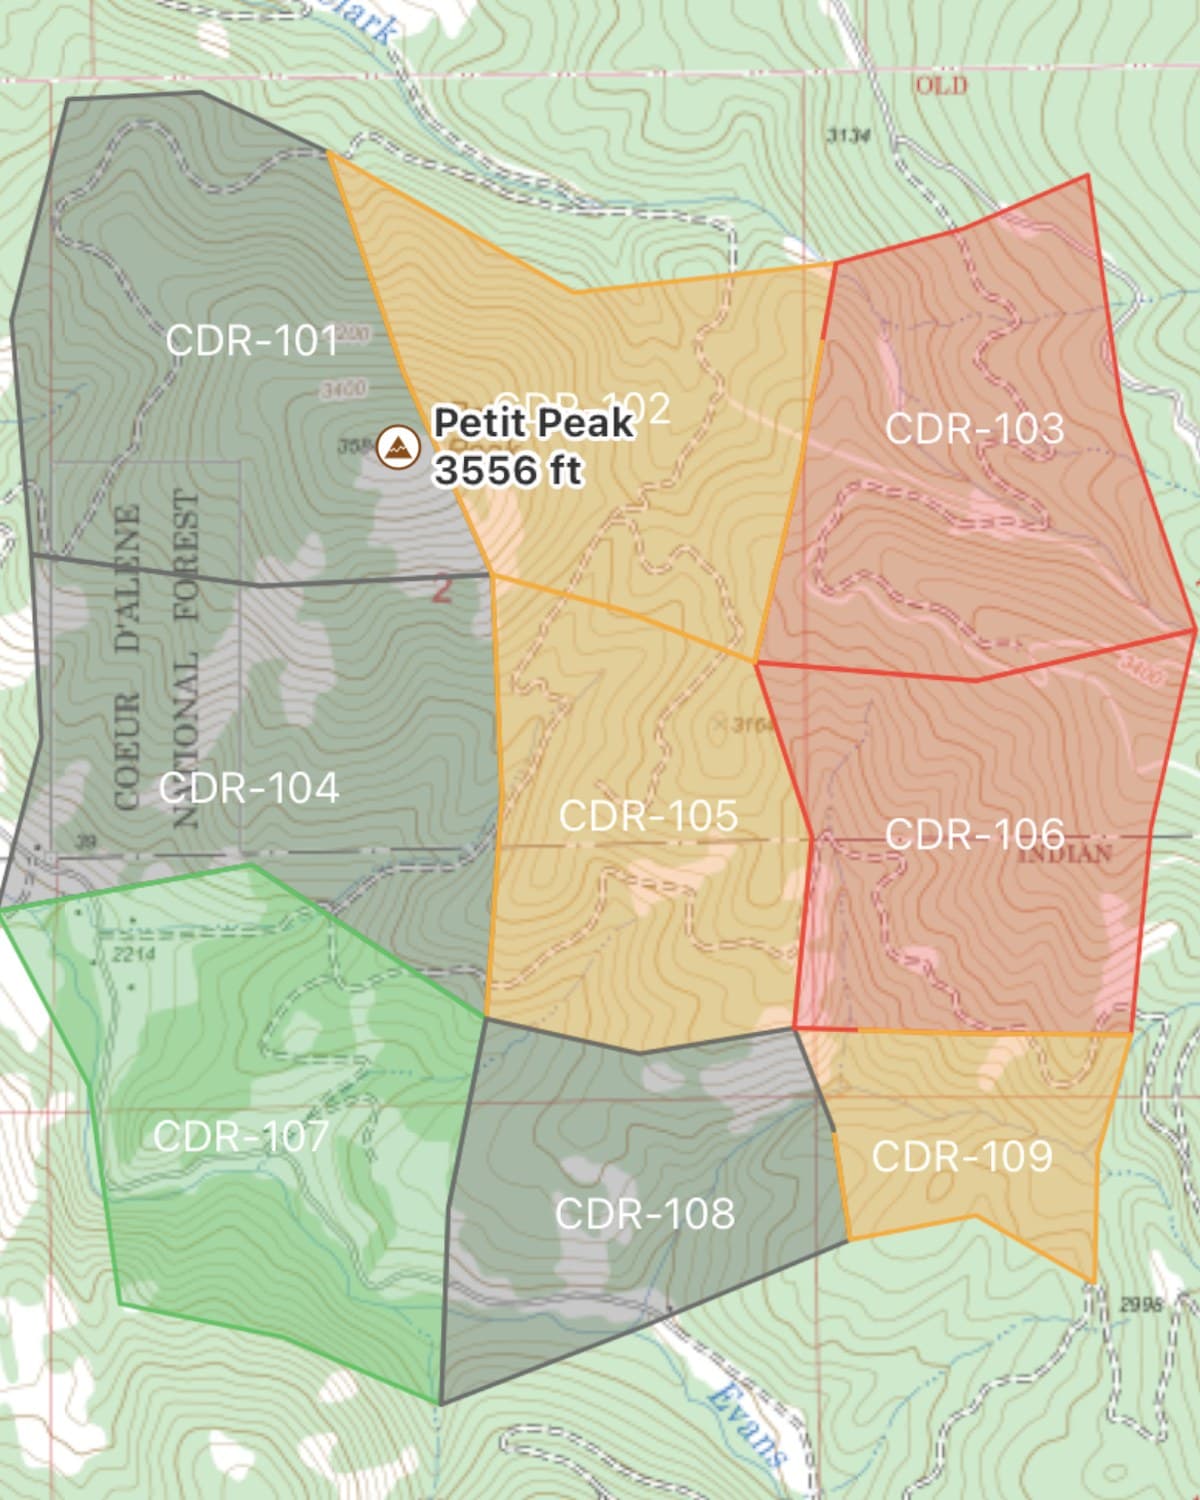
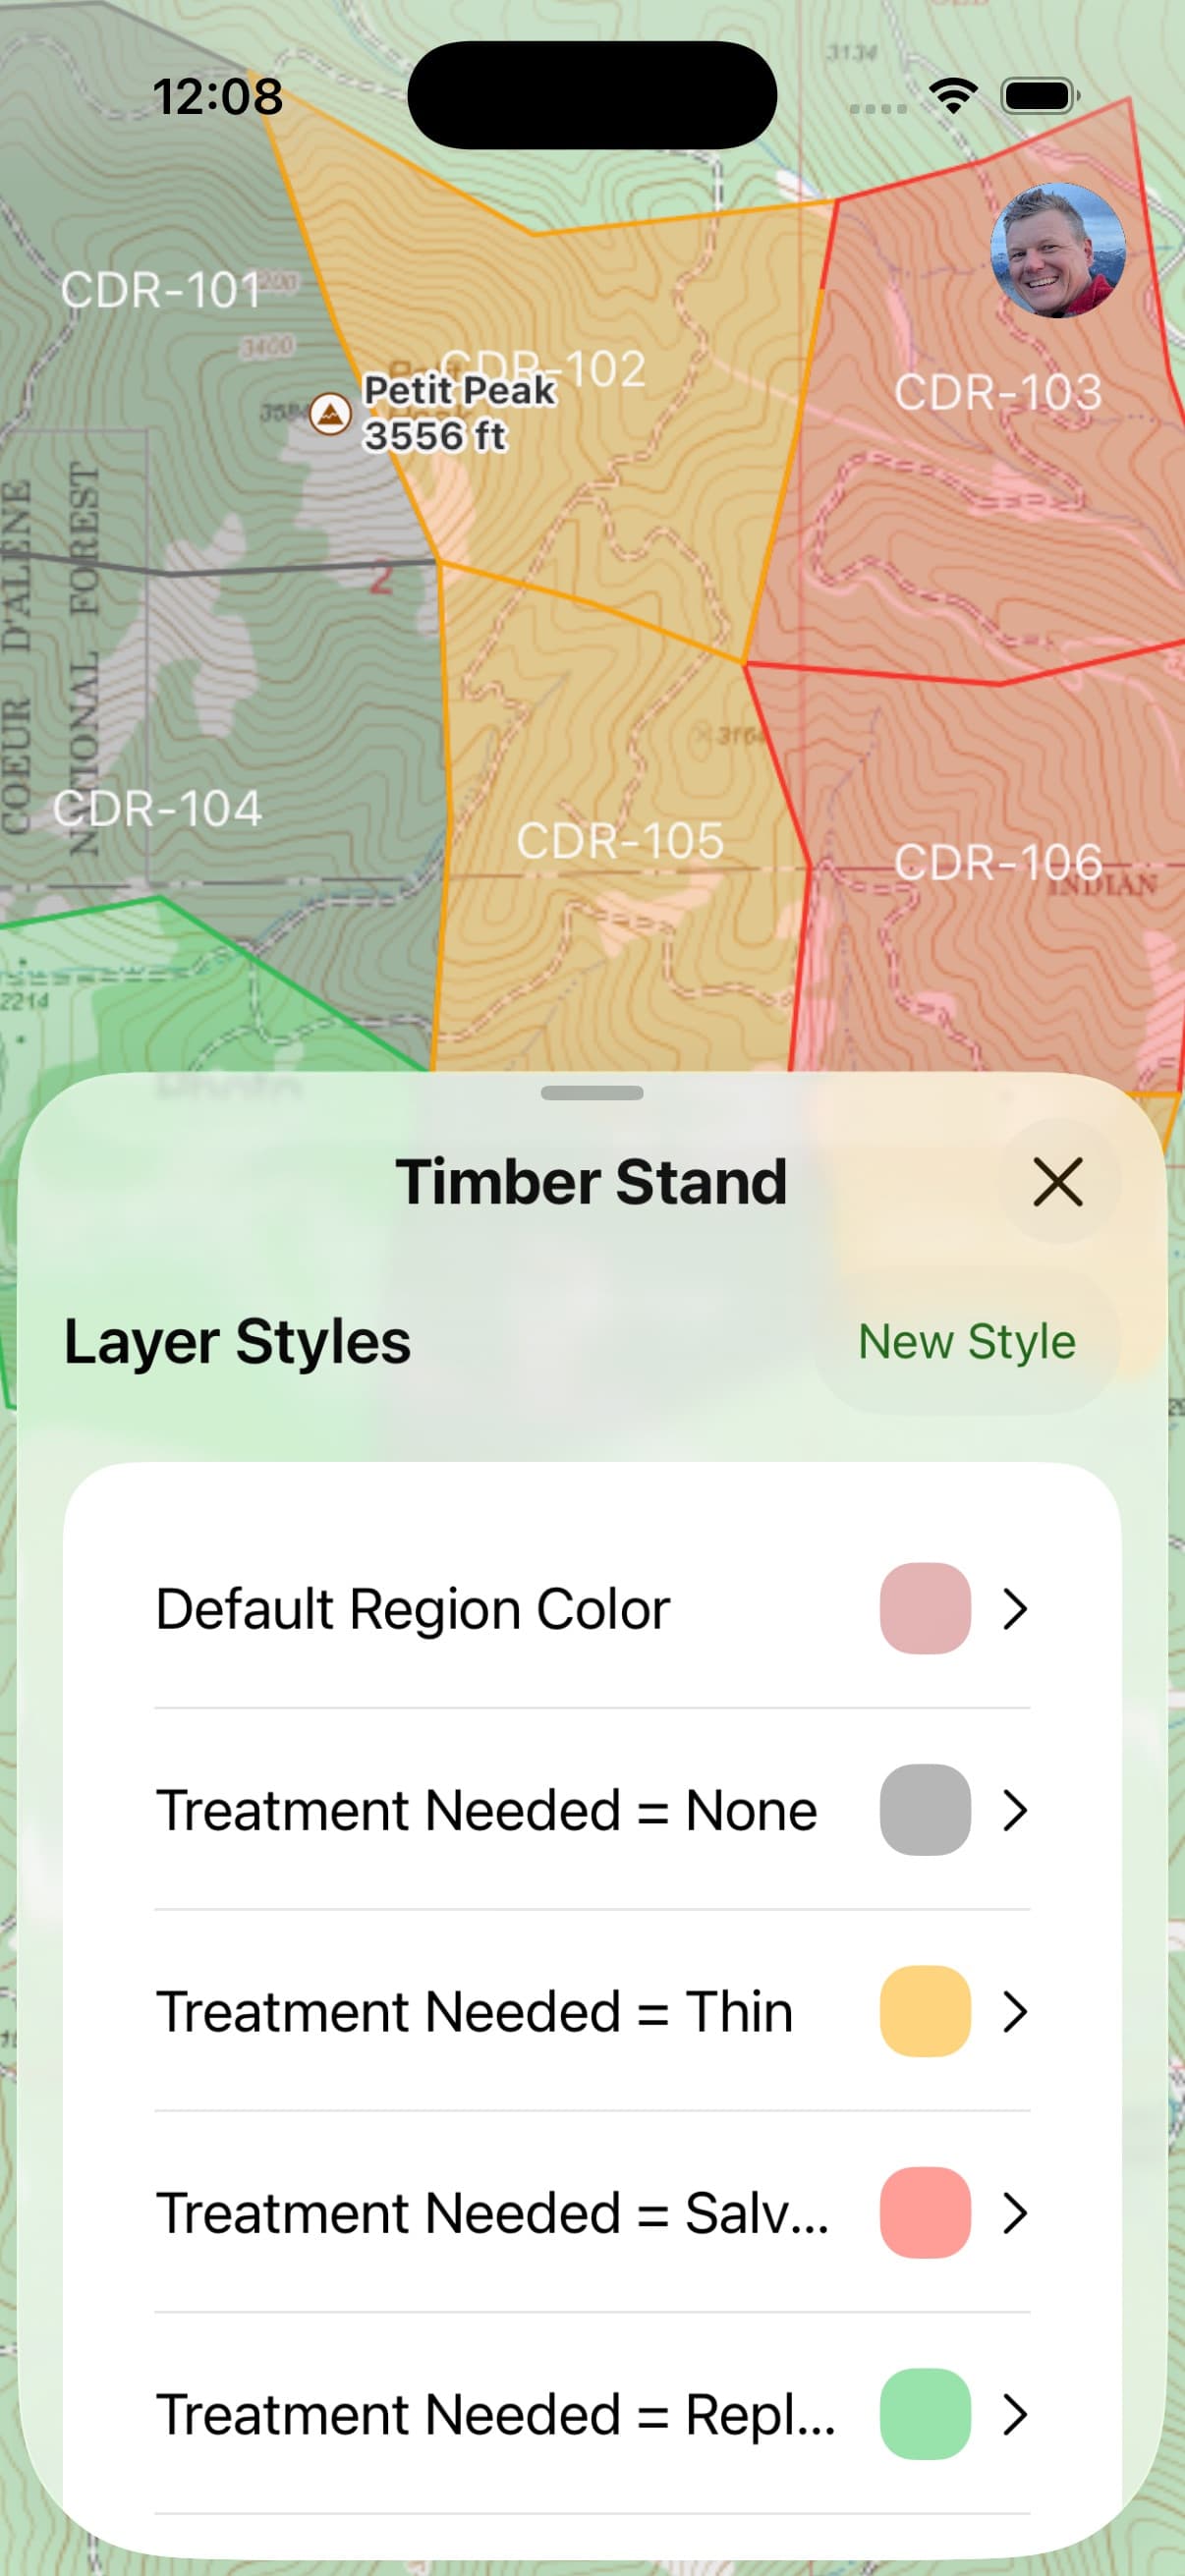
Color by Treatment needed — gray for none, amber for thin, red for salvage. Variable color across Stand age when you want the maturity picture instead.
The payoff
Drive the unit boundary and the whole property reads at a glance — what’s mature, what’s scheduled, what’s still open. Hand the crew a phone and they collect it identically to how you would.
Wildland fire
Structure protection triage
Values at risk, assessed fast, and everyone on the incident needs the same picture — including the crews with no bars of service.
Attributes
- Address (text)
- Triage category (pick list: Defensible-Prep / Defensible-Standalone / Non-Defensible-Prep / Non-Defensible / Rescue Drive-by)
- Water source on site (boolean)
- Access (pick list: Engine / Type 6 only / Foot only)
- Turnaround available (boolean)
- Assessed on (date)
- Photo
- Notes (note)
Style rule
Icon and color by Triage category — the standard triage colors, applied automatically as each structure is assessed.
The payoff
The division map colors itself as the assessment happens. Nobody redraws anything. Sync it to the strike team and every crew member is looking at the same triage picture on a map that keeps working all day without cell service.
Search & rescue
Search assignment tracking
Coverage is the whole job. Knowing what’s been searched, by whom, at what probability of detection — and what’s still open at hour six.
Attributes
- Segment number (number, auto-increment)
- Assigned team (text)
- Status (pick list: Not started / In progress / Complete / Needs re-search)
- POD estimate (decimal)
- Terrain (pick list: Open / Brush / Timber / Cliff / Water)
- Completed (date)
- Clue found (boolean)
- Photo
Style rule
Color by Status — red for not started, amber for in progress, green for complete. Separate layer for clues, styled by type.
The payoff
IC opens the map and sees exactly what’s covered and what isn’t, without a radio round-robin. Segments number themselves as you draw them, so nobody’s tracking which number is next at hour six. Pair it with Distance Rings from the last known point and you’ve got a plan you can brief off — or print for the crew who’d rather carry paper.
Utility & infrastructure
Asset inspection route
Poles, valves, meters, culverts, hydrants. The same fields on every one, an inspection date, and a photo that proves it.
Attributes
- Asset ID (text)
- Asset type (pick list)
- Condition (pick list: Good / Fair / Poor / Failed)
- Last inspected (date)
- Vegetation clearance needed (boolean)
- Access notes (note)
- Photo
Style rule
Icon by Asset type, color by Condition. Failed assets jump off the map in red.
The payoff
A repair list that builds itself. Export the layer when you’re back in signal, or hand it to whoever’s running the work orders.
Trail crews, land trusts, parks
Trail maintenance log
Blowdowns, washouts, sign replacements, drainage work. Reported by whoever’s out there, tracked until it’s fixed.
Attributes
- Issue type (pick list: Blowdown / Washout / Erosion / Sign / Bridge / Drainage)
- Severity (pick list: Low / Medium / High / Impassable)
- Crew size needed (number)
- Tools required (note)
- Status (pick list: Reported / Scheduled / Complete)
- Reported (date)
- Photo
Style rule
Icon by Issue type, color by Status. Variable color by Severity when you’re prioritizing the season’s work.
The payoff
Volunteers report from their phones without training. The work list is a map, and closing an item changes its color for everybody.
Biologists, weed districts, restoration crews
Invasive species treatment
Where the infestation is, how bad, what you sprayed, and whether it came back.
Attributes
- Species (pick list)
- Density (pick list: Trace / Light / Moderate / Heavy)
- Area treated (decimal, acres)
- Treatment method (pick list: Spray / Mechanical / Biological)
- Date treated (date)
- Retreat needed (boolean)
- Photo
Style rule
Draw the infestations as areas, variable color across Density. The hot spots are literally hot on the map.
The payoff
Year-over-year comparison you can see instead of calculate. Export to shapefile for the report that has to go to the agency.
Hunters
Trail cams and stands
Every camera and every stand, with the details that decide where you sit on opening morning.
Attributes
- Site name (text)
- Type (pick list: Camera / Stand / Blind / Mineral / Food plot)
- Last checked (date)
- Battery level (pick list: Full / Half / Low / Dead)
- SD card pulled (boolean)
- Wind direction it works (pick list: N / NE / E / SE / S / SW / W / NW)
- Activity rating (number, 1–5)
- Photo
Style rule
Icon by Type, variable color across Activity rating — your hottest sites glow, the dead ones fade back.
The payoff
Wake up, check the wind, open the map, and the right sit is obvious. Plus you know which cameras need batteries before you hike in — not after.
Overlanders & off-roaders
Dispersed camp and route log
The spots worth going back to, and everything you wish you’d written down the first time.
Attributes
- Site name (text)
- Rig size that fits (pick list: Any / Mid-size / Full-size / Trailer OK)
- Shade (boolean)
- Water nearby (boolean)
- Cell signal (pick list: None / 1 bar / Usable)
- Fire ring (boolean)
- Road difficulty to reach (pick list: Easy / Moderate / Technical)
- Rating (number, 1–5)
- Last camped (date)
- Photo
Style rule
Variable color across Rating, icon by Road difficulty. Style your recorded routes by difficulty too, so the whole road network reads at a glance.
The payoff
Three years of scouting turns into a map you can plan a trip off in five minutes. Share the layer with the people you travel with and everyone’s spots go in one place.
Fence lines and water infrastructure. Beehive placements. Survey monuments. Mushroom patches. Archaeological sites. Storm damage assessments. Snow study plots. If the same handful of questions comes up every time you mark something — that’s a Data Layer.
Shapefiles
Bring your existing data with you. Take it back out.
Import a shapefile and Topo Maps+ reads its attribute table straight into the layer — every field, on every feature, ready to use for styling and editing. Unit boundaries from the agency, parcel data from the county, last year’s survey, the project map somebody emailed you. It comes in as a working layer, not a flat picture.
Export the same way when you’re done — from iPhone, iPad, or Mac — and your fieldwork goes back to whoever needs it in the format they already use.
No conversion step. No middleman. No asking anyone for a license to open your own data.
What shapefiles can’t hold.
Worth knowing before you build a layer around it. The shapefile format dates to the early ’90s, and it’s stricter than we are:
- Field names get shortened. Shapefiles cap attribute names at 10 characters, so Treatment needed comes out as something shorter. Long text values can get clipped too.
- Photos don’t travel. The format has no concept of an image, so an export carries the photo’s ID — a reference — not the picture. Your photos stay intact in Topo Maps+; they just can’t ride along in a
.shp.
Nothing is lost on our side. Your full attribute names, your long notes, and your photos all stay exactly as you recorded them. It’s the destination format that’s narrow, not the layer. Plan for it when the deliverable has to be a shapefile, and don’t think about it at all when it doesn’t.
Team sync
One layer. The whole crew.
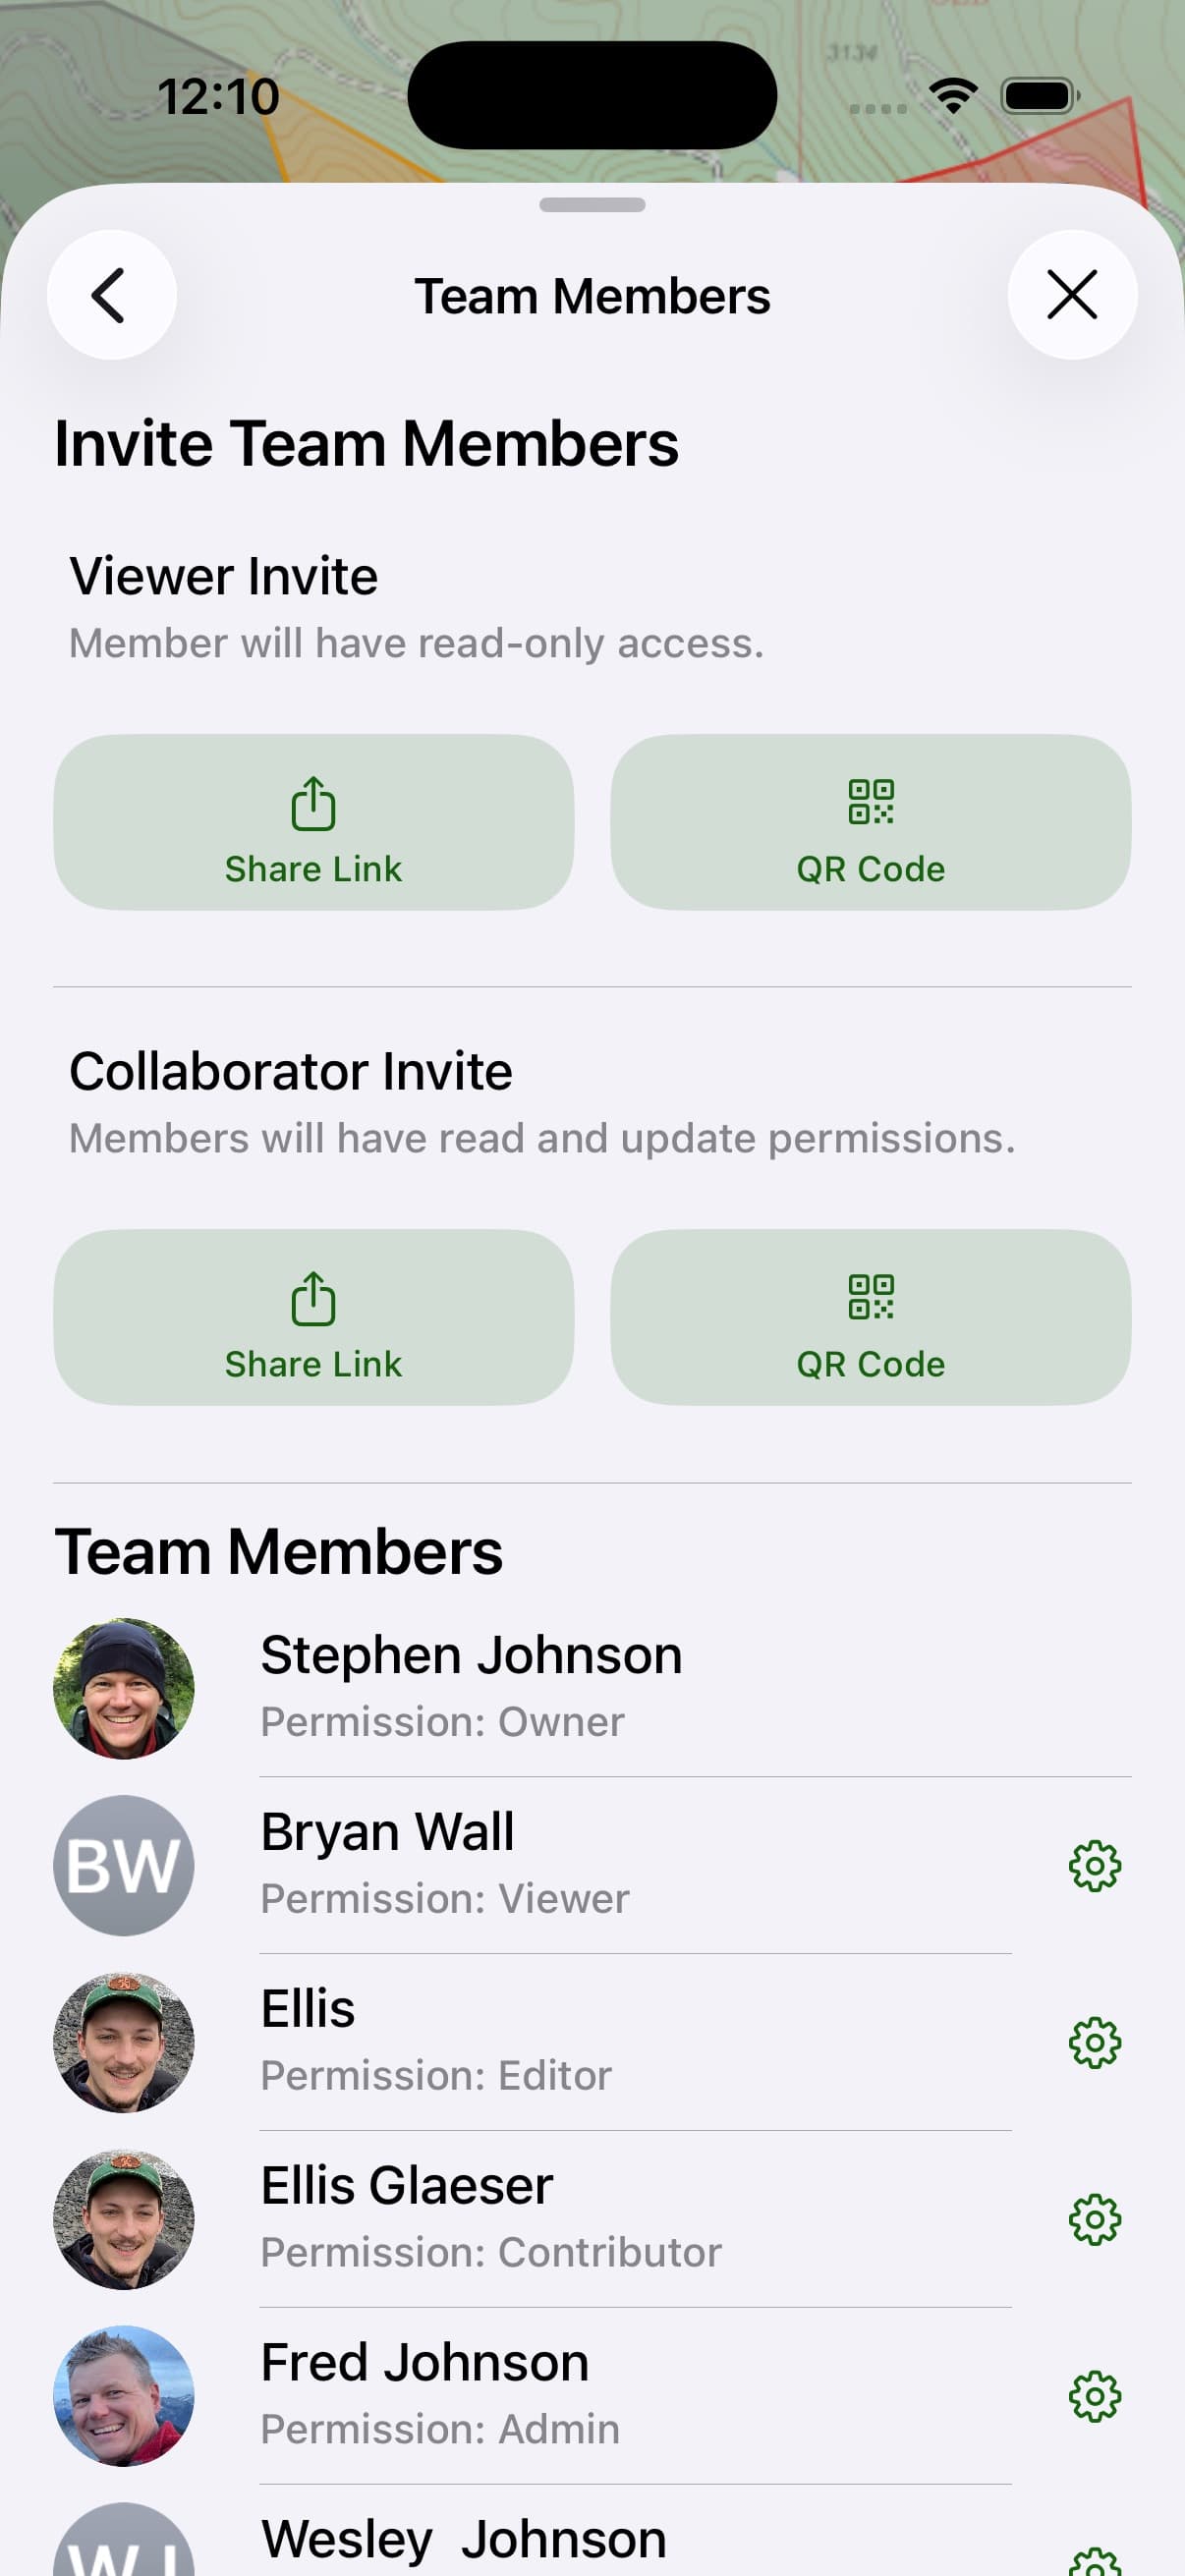
Build the layer once and share it across the team through your Topo Maps+ account. Everybody collects against the same schema, sees the same styles, and works from the same picture. Data flows back as people come into signal.
Teams are free to create. Bring in your crew, share routes, waypoints, and Data Layers, and start working together the same day.
Comparison
The ArcGIS Field Maps alternative that doesn’t need a GIS department.
Same job in the field. A fraction of the cost, and you can set it up this afternoon.
If you’ve run Field Maps on a phone in the backcountry, you know the friction. It’s a capable system, but it’s a system — a web map published from an ArcGIS Online organization, seats licensed by user type, an admin who knows how it all fits together, and a procurement cycle any time the crew grows.
For a lot of field work, that’s more machinery than the job requires. You need to record a consistent set of fields on a map you can trust offline, see the results in color, and get the data back out. That’s it.
Data Layers do that part. You build the schema on your phone in minutes, not in a browser-based org you have to administer. It rides on top of a map that was built for backcountry navigation first, so it doesn’t crawl when you’re eight miles in. And it’s included in Elite — one flat subscription per person, no seats to negotiate.
To be fair: if you’re running an enterprise geodatabase, complex related tables, and workflows built by a GIS team, Field Maps is doing things we don’t. Data Layers are for the much larger group of field people who need structured data on a reliable map — and who’ve been quoted a platform to get it.
ArcGIS and ArcGIS Field Maps are trademarks of Esri.
Going further
When you’re ready for more.
Data Layer Groups
Share one set of attributes and styles across several layers, so a season’s worth of units all follow the same rules.
Auto-save new content
Set a layer as the destination and every waypoint, route, or area you create lands there automatically, prompts and all.
Zoom-level control
Decide when titles and full-size icons appear, so a dense layer stays readable zoomed out.
Manual overrides
Style an individual object by hand when it needs to stand apart from the rules.
Titles from attributes
Pick which field shows on the map as the label.
Nothing you record expires.
A season of fieldwork is worth more than a subscription. So if you cancel, your data doesn’t go anywhere — your layers stay on our servers exactly as you left them. Come back in two months or two years and it’s all still there, attributes and photos intact.
And if you’d rather it were gone, that’s your call too: deleting your account deletes all of it.
Getting started
Start with one layer and four attributes.
Don’t design the perfect schema. Pick the thing you mark most often, write down the four questions you always end up asking about it, and make those your attributes. Add a style rule for the one that matters most.
Use it for a week. You’ll know exactly what to add.
FAQ
Data Layers, answered
What’s a Data Layer, in one sentence?
A map layer where you define what information every point, line, and area has to record — and then style the map based on that information.
Which plan includes it?
Elite. The 7-day free trial unlocks Elite so you can build one before you decide.
Does it work offline?
Yes. Define layers, collect data, and view your styles with no cell service. Everything syncs when you’re back in signal.
Do I need to know GIS?
No. If you can build a form, you can build a Data Layer. There’s no server, no publishing step, and no org to administer.
Can my whole crew use the same layer?
Yes. Teams are free to create, and layers sync to everyone on the team.
Is this a replacement for ArcGIS Field Maps?
For a lot of field work, yes — and for far less money and setup. If you’re running enterprise geodatabases and GIS-team-built workflows, it isn’t. Most people asking this question are in the first group.
What kinds of information can I record?
Seven types: text (open or a fixed pick list), note, number (with optional auto-increment), decimal number, date, photo, and true/false.
How many attributes can one layer have?
As many as the job needs. There’s no limit.
What happens to my data if I cancel?
It stays on our servers. Nothing is deleted, nothing expires. Resubscribe in two months or two years and your layers are exactly where you left them. If you’d rather it were gone, deleting your account deletes all of it.
Can I import my existing data?
Yes — import a shapefile and its attribute table becomes the layer’s attributes. Export back out from iPhone, iPad, or Mac when you’re done, keeping in mind that the shapefile format shortens long field names and can’t carry photos.
Try it
Your fieldwork deserves better than a pin and a note.
Build your first Data Layer in about ten minutes. See what your map looks like when it knows what it’s showing you.